

RunStocks
Historical analytics for small-cap gaps and runs, built for day traders.
Introduction
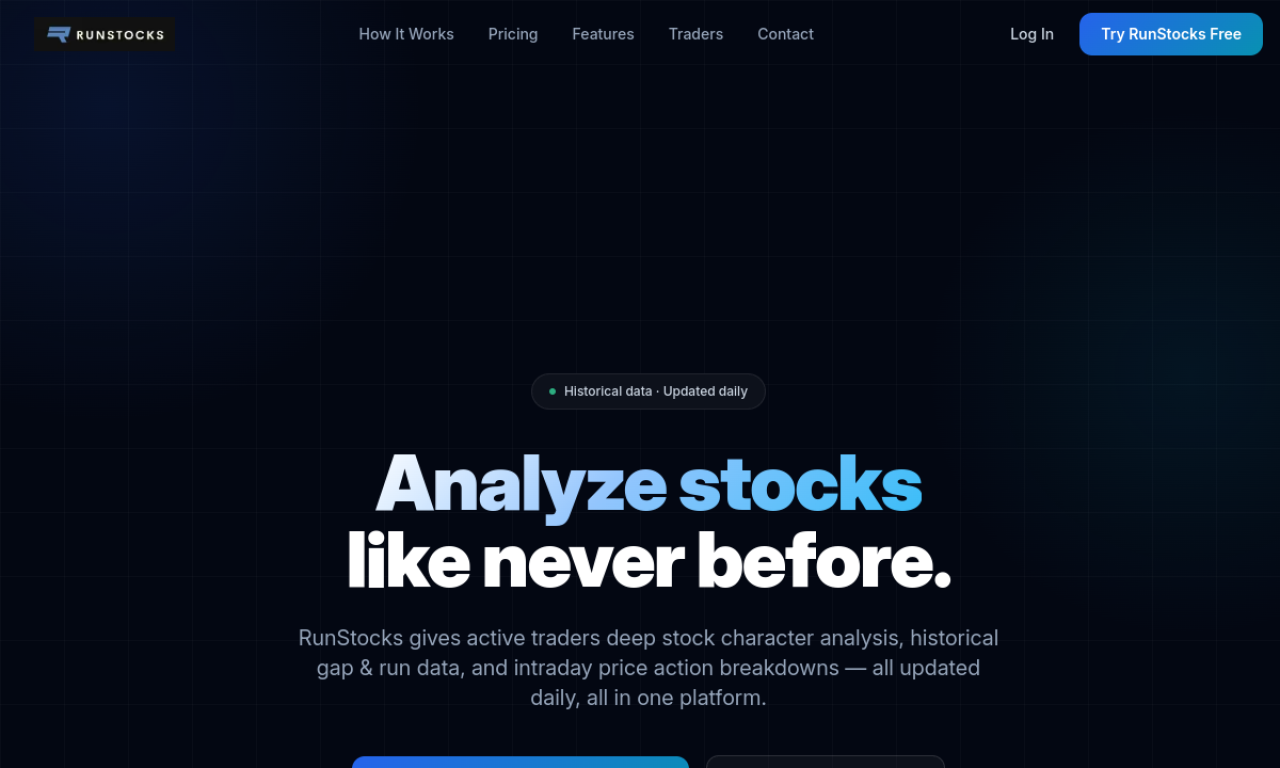
RunStocks is an analytics platform that focuses on small-cap stocks with large gap-ups and intraday runs. It provides historical data since 2022, price action charts, volume trends, and fundamentals. A free tier offers limited history, and a paid subscription unlocks the full dataset.
- Added on
- Nov 2, 2026
- Website
- www.runstocks.com
- Pricing model
- Freemium
- Company
- RunStocks
Product information
What is RunStocks?
RunStocks is a data tool for day traders that studies how small-cap stocks behave after gaps of 20% or more and runs of 50% or more.
How to use RunStocks?
Sign in to the app, search for a ticker, review its historical gaps and runs, and check price action and volume on the charts.
Core features of RunStocks
- Ticker-level character analysis
- Intraday price action analysis
- Adjustments for reverse splits
- Historical data since 2022
- End-of-day calendar of gaps and runs
- Fundamental data for each ticker
Use cases of RunStocks
- 1Studying how small caps behaved after past gaps
- 2Finding setups based on historical price and volume patterns
- 3Refining day-trading strategies with data
Frequently asked questions about RunStocks
What is a gap and a run in RunStocks?+
A gap is an opening well above the prior close, and RunStocks focuses on gap-ups of 20% or more. A run is an intraday move of at least 50% from the open.
Is there a free version?+
Yes, with limits: ticker-level gap and run data covers the last 4 months, and market-wide analysis covers the last 7 days.
Is there an API?+
According to the site, data is currently available only through the app, and an API is in development.
Which category is RunStocks in?+
RunStocks is listed under AI Trading & Investing.